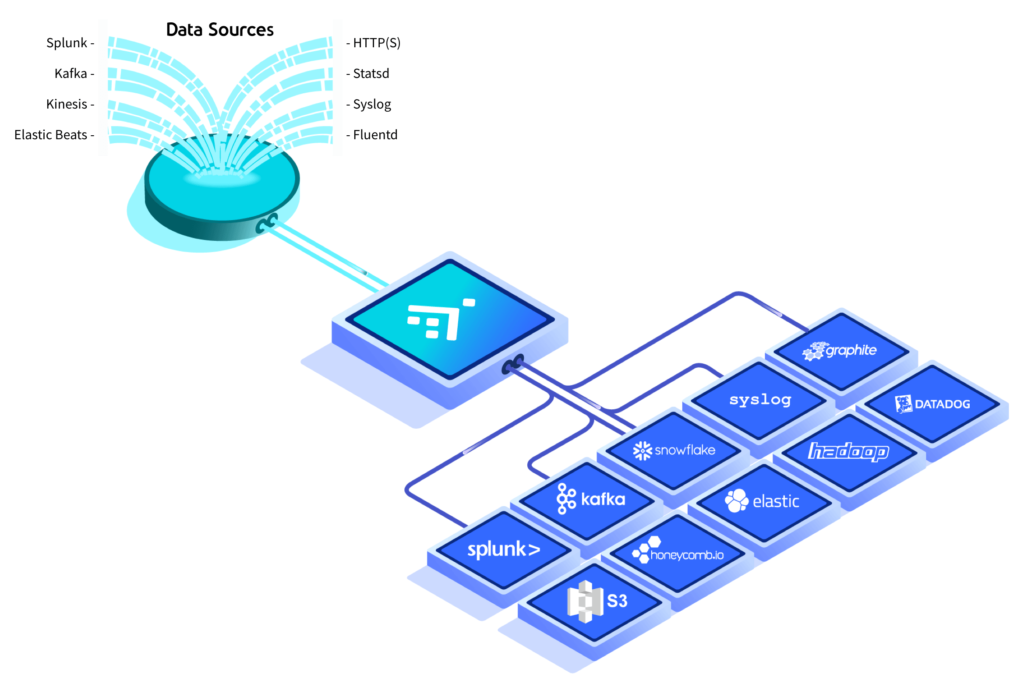
While you are implementing Data Observability for Pipeline, it may be difficult to monitor your pipeline, because it does not have any standardized logging policies. While some teams may use a log of every action that happens on their pipeline to ensure that their business rules are met, other teams may simply run algorithms on datasets, without monitoring them at all.
Lineage documentation
When it comes to pipeline documentation, data observability plays a crucial role. By providing visibility into the entire pipeline, it becomes easier for data teams to isolate and resolve data issues. With a data observability tool, they can identify any problems and quickly identify the source. This enables them to improve the speed of data discovery processes, reducing the amount of time spent manually investigating and resolving issues.
In the past, data engineers would rely on tests to detect data quality issues. However, as companies started consuming more data, this practice became inefficient. Teams now have hundreds of tests to cover predictable issues, but they lack context to decipher why data quality issues have occurred. With data observability, they can learn from data incidents and avoid them before they become a catastrophe.
Monitoring
With the proliferation of internet-of-things devices, more data is created, which can be valuable in analyzing system behavior. To get a better understanding of this data, an observability pipeline combines data collected from IT operations management tools with data from other sources. This technology helps suppress noise and highlight actionable situations. It can also help amplify incident management through textual and visual communication.
Observability can help organizations gain a clearer picture of system performance and detect problems in real time. It uses lightweight instrumentation to collect data and stitch it together in a unified view of distributed systems.
Alerting
When it comes to data observation for pipelines, there are several important considerations that you should keep in mind. First, you should make sure that your alerting system can process and store data efficiently. Second, you should use a timestamped database for all data. Third, you should consider how you’ll trace the requests made by your users. This will allow you to calculate the total number of successful and failed requests, as well as their success and failure rates. You can then combine this data to get an overall picture of the system’s response times.
Lastly, you should know that the Data Collector can run pipelines and provide real-time statistics about the pipeline’s status. It can also help you create rules and trigger alerts for different kinds of events. For example, you can select a stage from a pipeline and view a sample of the data it is processing.
Exploration
Pipelines enable EDA by combining operations or atomic requests. For example, if a policymaker from the European Union wants to know how many investigators participated in EU-funded projects, he can filter the results by cost and divide the results by framework program. Then, he can ask for each investigator’s PIs in the selected subset, using the join operation. Finally, he can expand the returned dataset with by-superset to include projects that overlap.
Data exploration helps discover new patterns in data, and it also helps find actionable insights. It can also reduce the time needed to conduct analysis. It can be useful for a variety of fields, such as data science and research & development. Modern analytics tools make it easy to explore data visually.
Identifying breakdowns
Modern data pipelines are intricately connected, and the quality of one component can influence the accuracy of another. This is especially true of internal data, which can become faulty, inconsistent, or even missing, and therefore affect the correctness of dependent data assets. To effectively resolve such data issues, data teams need to have full visibility of their data stack. With data observability, they can easily spot issues in their pipeline, triage them, and address them in a proactive manner.
In addition to monitoring the data quality and volume, pipeline data observeability can also be used to identify data distribution and schema. These metrics can help your pipeline team find problems more efficiently, reducing friction and allowing them to work on other aspects of the pipeline. Automation can be used to send alerts to the appropriate teams whenever a problem is detected.

